You are picking between two ways of grading a model’s attempts during training. One is a checker: it reads an answer and says right or wrong, nothing in between (the rule-based setup known as RLVR, reinforcement learning with verifiable rewards). The other is a reward model: a trained scorer that reads the same answer and hands back a number, a graded sense of how good the attempt was, even among the ones that are technically wrong. Think of two graders marking the same stack of papers. One carries a stamp, PASS or FAIL. The other writes a score out of a hundred. Hand both of them two failing answers, one nearly right and one hopeless: the stamp reads FAIL on each, the score reads a 40 on one and a 5 on the other. You run a cheap comparison between a checker and a reward model at small scale and one wins. Will that winner still win once you train at the size you actually ship?
The closest evidence is from pretraining optimizer comparisons (arXiv:2512.05620). Even careful, scale-aware studies there disagree with each other, from a steady 2x speed advantage at one end to nothing at the other, over the same range of model sizes. This piece brings a cheap quantity to that bet, the fraction of training questions where the training update is mathematically forced to be exactly zero, and traces it across two tasks and two model sizes before any training starts. The quantity itself is not new. DAPO (arXiv:2503.14476) named the zero-advantage group in 2025 and built a remedy around it, dynamic sampling, which keeps drawing until a batch carries enough groups whose attempts disagree. What this piece adds is the measured trace: the same rate read on the same task at two model sizes, treated as something to forecast from rather than something to filter away.
What this piece found
- The training method in question (GRPO-family reinforcement learning) learns only from disagreement among its own sampled attempts. When every attempt at a question gets the same grade, the weight update for that question is exactly zero, proven for the GRPO family (arXiv:2607.00152), which states the result for the on-policy first step, and approximately zero in the common setups that add a KL penalty. Call the fraction of questions where all attempts tie the shut-gate rate. Reward choice can only matter where the gate is open.
- The gate moves with difficulty and with model size, measured before any training: a harder task left the gate shut about 3x as often on the same model, and tripling model size (Qwen2.5-0.5B to 1.5B) roughly halved the shut-gate rate on grade-school math, 0.484 to 0.244. Single-seed readings.
- Where the gate was mostly open, 3 trained reward-model variants landed 1.6 to 5.4 points above the plain right/wrong checker, every one of those gaps inside the roughly 6-point margin a single training run cannot resolve. A consistent direction, not a proven ranking. Single-seed.
- What the study’s own rule ends up calling: no winner. Three runs differing only in random seed compared the reward model GRM-Gemma2-2.6B (published as Ray2333/GRM-Gemma2-2B-rewardmodel-ft, named for its 2B-class Gemma-2 base, which carries 2.6 billion parameters) against a copy of itself trained with half its reward signal replaced by random noise, on the instruction-following task, scored by the FsfairX judge on length-corrected votes. Two seeds favored the intact signal by wide margins (131 wins to 87 and 145 to 68). One leaned the other way (83 wins to 108 of 191 decided votes, meaning votes where the judge saw a difference, and a fair coin would produce a split at least this uneven about 8% of the time, p = 0.082). This piece’s bar for declaring a winner asks two things at once: a pooled per-prompt majority vote significant on an exact two-sided binomial test, and every seed’s own sign agreeing with the majority. In plain terms, each question gets one combined verdict from the three runs, that tally has to be strong enough that chance explains it poorly, and no individual run may point the other way. The combined verdict here does favor the intact signal, 147 questions to 104 with 74 undecided, p = 0.0079. The dissenting seed points the other way, so the rule calls no winner. What it does support is a bound taken from that seed, picked because it is the seed that failed rather than because it is representative: on that seed the intact signal’s win share sits between 36% and 51% at 95% confidence, anywhere from clearly behind to dead even, never ahead. The other 2 seeds each bound the same quantity entirely above 50%. Quoting the worst of the three is the conservative choice, not a reading of a typical run.
- One before-you-train forecast has been scored against real trained outcomes, in three settings. On closed-book trivia the plain checker finished 2.2 points ahead, an interval of [0.2, 4.4] at 95% confidence that excludes zero, and about 9% of that gap survived once answers were credited for content rather than exact wording. On the two grade-school-math settings the intervals span zero at both evaluation pool sizes tried. The zero-update mechanism is arithmetic. The tie counts are measurements that repeat. Three settings decide nothing on their own.
- Settling it costs $20 to $60 at the scale this piece works at, and about $95 to $280 at the 7B-class scale a skeptical reader should demand.
1. The gate: why reward choice sometimes cannot matter
GRPO (group relative policy optimization), the training recipe behind this comparison, samples several attempts at the same question, grades each one, and nudges the model toward whichever attempts scored better than the others in that group. It is a relative judgment, not a fixed bar: like a grade set by where you land relative to the rest of the room, not by a fixed cutoff. Score 70 on an exam everyone aced and you are below average. Score the same 70 where everyone struggled and you are top of the class. The exam did not change. Your standing relative to the group did.
Push that to its edge. Ask the model the same question 8 times and every attempt comes back wrong, or every attempt comes back right. Nobody stood out, because everybody matched. DAPO (arXiv:2503.14476) named this in 2025, informally, calling it the gradient-decreasing problem and making it the motivation for its dynamic sampling filter. A 2026 paper derived it as near-zero advantage collapse (arXiv:2605.21125, submitted 20 May 2026), and a proof about six weeks after that (arXiv:2607.00152, submitted 30 June 2026) makes it exact. When a group is uniform like that, the update to the model from that group is not small. It is precisely zero. Whatever the training signal is, a plain checker or an elaborate learned scorer, it never gets a vote, because there was no disagreement within the group for it to break.
That exactness carries one condition worth stating in plain sight. The proof is stated for the on-policy first step of the group-relative objective, and its own limitations section sets clipping, the KL penalty to a reference policy, off-policy staleness, and non-binary rewards aside. Common implementations do carry a KL term or an entropy bonus, and those terms do not vanish on a tied group, so in a real training loop the honest word is approximately zero rather than exactly zero. The part that stays exactly zero is the part this piece is about: the reward’s own contribution. A regularizer pulls the model toward a reference policy whatever the grades were, which is another way of saying reward choice still gets no vote there.
Call this a gate. A shut gate carries no training signal no matter which reward graded it. An open gate, where attempts actually disagree, is the only place reward choice can act.
Two real questions from a base-model GSM8K measurement show both cases.
| Case | Question (abridged) | Gold answer | 8 sampled attempts | Outcome |
|---|---|---|---|---|
| Gate shut | “A factory used to make tractors, but now makes silos… What percentage more are they making per day now?” | 10 | 120, 14.14, 100, 122, 24, 34, 20, 9.9 | None of the 8 attempts match the gold answer. Nobody stood out, gate shut. |
| Gate open | “Comet Halley orbits the sun every 75 years… How old was Bill when he saw the Comet for the first time?” | 15 | 15, 2, 45, 60, 0, 90, 32.17, 60 | One attempt matches. It disagrees with the other 7, so this group has something for reward choice to act on. |
How often the gate is open is arithmetic, not a discovery. If a model answers a question correctly with probability p, and you sample n attempts, the chance every attempt lands the same way is
P(all n agree) = p^n + (1-p)^n
The first term is the chance all n attempts land right, the second the chance all n land wrong, and a tie is either one.
At p = 0.9 and n = 8: 0.9^8 + 0.1^8 = 0.430. A question the model has nearly mastered still ties 43% of the time. Put p = 0.1 into the same formula and it returns the same 0.430. Put p = 0.5 in and it bottoms out at 0.008. The curve is U-shaped in p, high at both ends and lowest where the model is right about half the time.
Which way capability moves the gate therefore depends on which side of that minimum a question sits. Climbing from p = 0.1 toward p = 0.5 drives the tie rate down. Climbing from p = 0.5 toward p = 0.9 drives it back up. The questions measured here sit overwhelmingly on the low side, and the composition of their ties says so directly. On base-model GSM8K at 0.5B, all 121 tied questions out of 250 were tied all-wrong and not one was tied all-right, and at 1.5B the tied mass splits into 19.2% tied all-wrong and 5.2% tied all-right. That is why the table below shows the gate opening as models get bigger, while the same arithmetic says material a model has mostly mastered shuts it again, for the same reason a coin that lands heads 95% of the time gives you 8 heads in a row far more often than a fair coin does. Both readings are the one curve, seen from its two sides.
That the gate moves with capability is expected by construction. Which direction it moves is not, because that is set by where a task’s questions sit against the minimum, and that is a measurement rather than a deduction. Whether the gate is the specific channel through which capability changes training outcomes, rather than merely correlated with them, is the open, unproven claim this piece is actually built on.
Measured shut-gate rates, before and during training, across tasks and sizes:
| Task | Model size | Shut-gate rate | Reading |
|---|---|---|---|
| Harder math (MATH, Level 3-5), trained | 1.5B | 0.62-0.64 | harder task, trained: mostly shut |
| Grade-school math (GSM8K), trained | 1.5B | ~0.206 | same model, easier task: mostly open |
| Closed-book trivia (TriviaQA), in training | 0.5B | 0.759 | recall task: mostly shut |
| Closed-book trivia (TriviaQA), in training | 1.5B | 0.623 | same task, tripled size: narrows, still mostly shut |
| GSM8K, base model, no training | 0.5B | 0.484 [0.423, 0.546] | untrained: about half of groups already tie |
| GSM8K, base model, no training | 1.5B | 0.244 [0.195, 0.301] | tripling size: gate drops by nearly half, intervals disjoint |
Bracketed numbers are 95% confidence intervals, the plausible range for the true value, not the measurement itself. All rows single-seed. The 2 trivia rows are in-training rates from the earlier TriviaQA runs described in section 5, read at sampling temperature 1.2 against 0.8 for every other row and over a different training horizon, so they belong in the table as separate readings and not as numbers to subtract from the base-model rows beneath them. The 2 trained rows are also not the same kind of reading. The grade-school-math rate is what the checker saw live in its own run. The harder-math rate is a right/wrong rate recomputed afterwards from the stored attempts, which is what a checker would have seen on that task. The runs graded by a reward model there almost never produced an exact tie in their own continuous scores, so their live rate sat near zero.
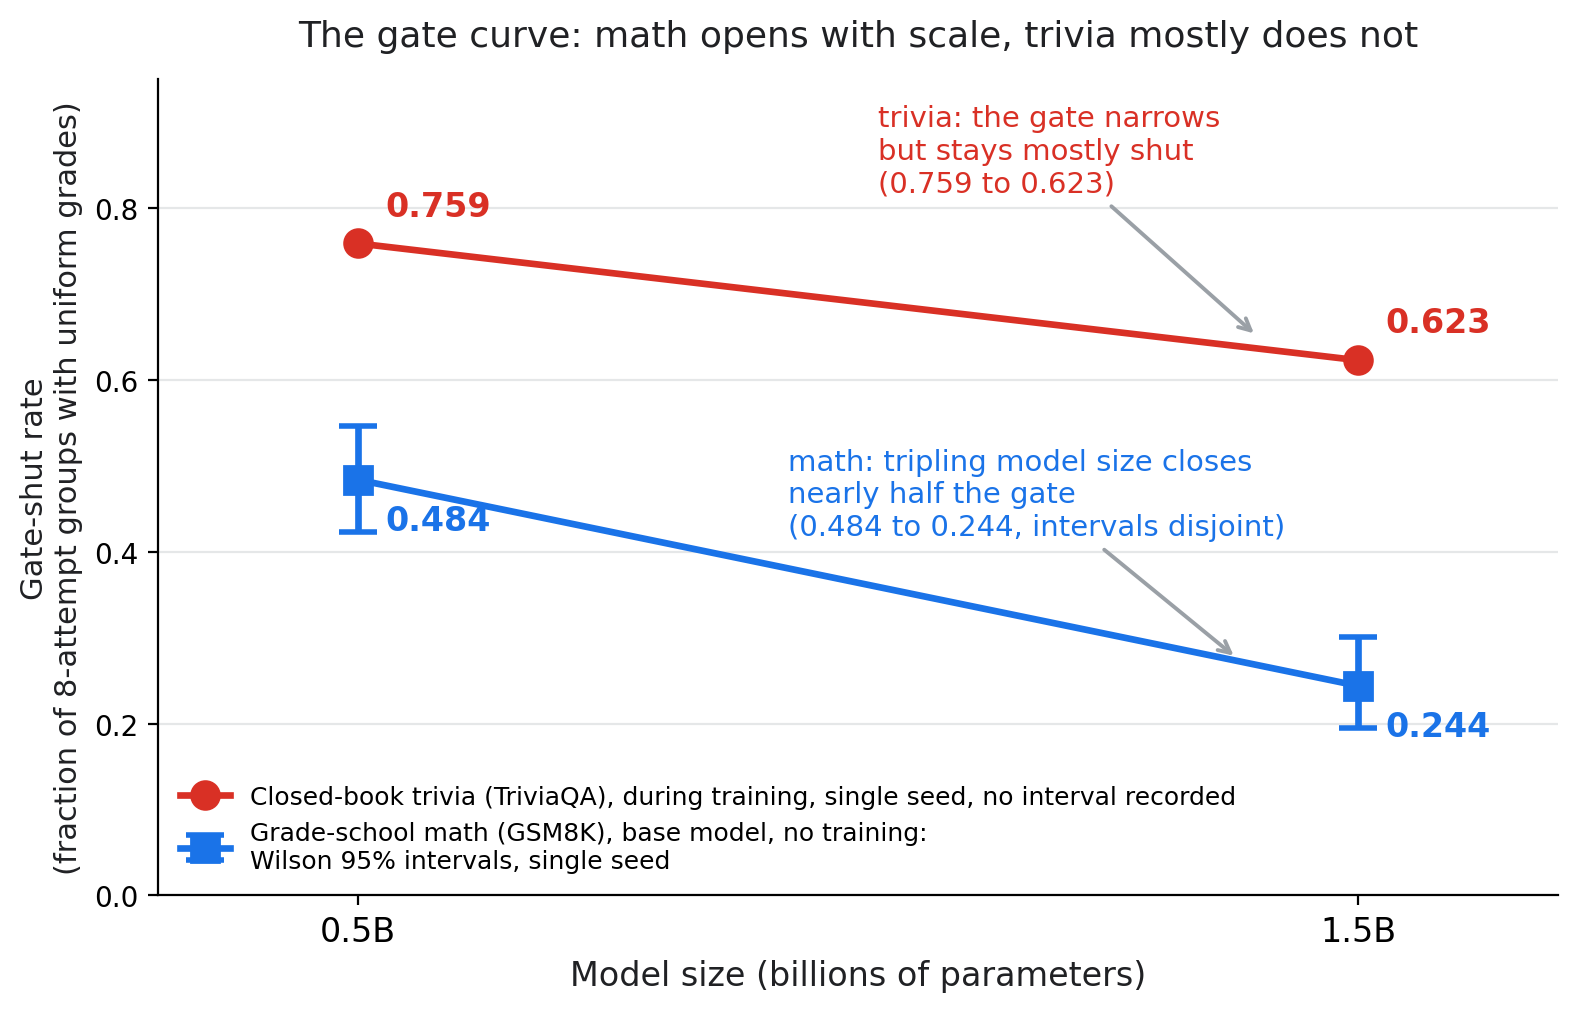
The shut-gate rate falls with scale on both tasks measured here, but starts and ends much higher on the recall task than on the reasoning task. The 2 lines are not one measurement. The math line is a base-model reading and the recall line is an in-training reading from the earlier runs, so read each line’s own slope and not the vertical distance between them.
Task difficulty moves the gate by a factor of 3 on one fixed-size model (MATH’s 0.62-0.64 against GSM8K’s 0.206). Model size moves it by roughly half on one fixed task (0.484 to 0.244). The two trivia rows show a different regime. Tripling model size narrows the gate from 0.759 to 0.623 but leaves it mostly shut, because what blocks a recall question is a missing fact, not shaky execution, and a bigger model knows more facts while still missing most of the rare ones. In the terms of the U-shaped curve, recall questions sit further out on the low side than math questions do, so the same climb in capability buys less gate. Section 5 returns to why that distinction matters.
One scope limit belongs here. The zero-update proof covers GRPO-family, group-relative methods. An older style of reinforcement learning, PPO (proximal policy optimization) with a learned value function as its baseline (Schulman et al. 2017, arXiv:1707.06347), scores each attempt against that separately learned baseline instead of against its own siblings in a group. Because PPO’s advantage is attempt minus a learned function’s estimate, not attempt minus the group’s own mean, a uniform group does not automatically zero it out the way group-normalization does. Whether an analogous gate exists there anyway has not been proven or measured. It is an open corner of the theory, not a claim this piece makes about PPO.
2. The $1.55 reading: measure the gate before you train
The gate is cheap to read. Sample a batch of rollouts from the model you plan to train, at the size and on the task you actually care about, grade them with your checker, and count how many groups came back uniform. No training involved, pure inference. The base-model gate curve above cost about $1.55 in total cloud compute, most of it a single small AWS instance running for under two hours.
Reading the gate also explains a piece of training machinery worth naming precisely, because it is easy to confuse with an unrelated setting of the same name. One of the reward variants tested on GSM8K is a tie-break blend: reward = checker grade + epsilon x within-class reward-model rank, where epsilon = 0.1. This epsilon is not GRPO’s clipping epsilon from the policy-gradient objective. It is a blend weight. It adds a ranked nudge inside each same-grade class of a group, which in a group the checker already called a tie means the whole group at once, and in a mixed group means the right attempts ranked among themselves and the wrong ones among themselves, using GRM-Gemma2-2.6B’s own ranking to do the ranking. Because an attempt graded right scores at least 1.0 and an attempt graded wrong scores at most 0.1, the blend can never overrule the checker’s ordering in a group where attempts actually disagree. On the GSM8K run, the tied groups where the blend is the entire signal made up about 21% of scored attempts (the tie-break blend’s own shut-gate rate was 24% against the checker-only variant’s 20.6%): that is the slice where epsilon decides everything rather than nothing. One caveat worth carrying: after GRPO’s own per-group advantage normalization, whatever non-zero signal epsilon contributes inside a formerly tied group gets rescaled to the group’s full standardized strength, not held down at its nominal 0.1 weight. It acts small in the reward, full strength in the update.
On that same GSM8K run, where the gate was mostly open, three trained reward-model variants all beat the plain right/wrong checker (the binary verifier in GRPO-style training, RLVR): GRM-Gemma2-2.6B by 5.4 points, the epsilon = 0.1 tie-break blend by 4.2 points, Skywork-Reward-V2-Qwen3-8B by 1.6 points.
| Variant | Gap over the checker |
|---|---|
| GRM-Gemma2-2.6B | +5.4 points |
| Epsilon = 0.1 tie-break blend | +4.2 points |
| Skywork-Reward-V2-Qwen3-8B | +1.6 points |
The middle row needs a caution the other two do not. The blend’s epsilon cancels under GRPO’s own per-group standardization, worked through at the end of this section, so whatever produced that run’s 4.2-point margin, it was not the amount of blend weight the variant is defined by. That row is a recorded outcome with its mechanism unaccounted for.
Part of that edge is mechanical rather than a reward-quality difference: the loss normalizes over the full batch of sampled sequences, live and dead groups alike, so the checker’s own dead groups (20.6% of the batch) contribute zero to the numerator while still counting in the denominator, diluting its per-step gradient by roughly 21%. Even accounting for that, every gap sits inside the roughly 6-point margin one single-seed run cannot rule out (worked out in section 4), so this is a directional pattern, not a proven one. A second signal comes from a related follow-up run: raising the tie-break blend’s own weight from epsilon = 0.1 to epsilon = 0.2, doubling how much GRM-Gemma2-2.6B’s ranking counts inside tied groups, moved mean accuracy over the last 3 checkpoints from 55.9% down to 53.3%, a 2.6-point move. That move is single-seed and sits inside the same roughly 6-point margin one run cannot rule out. Its direction, more weight on the reward model’s ranking producing a worse score, does not support the story that the reward model ranks better than the checker.
Those last two paragraphs are in tension. The normalization caveat says the standardized update inside a formerly tied group does not depend on epsilon’s size, because doubling the spread also doubles the divisor the group is standardized by. So doubling epsilon changes nothing at all in exactly the groups the blend was designed for. The only place it can act is inside groups that already mix right and wrong attempts, where it shifts how much the within-class ranking counts against the grade itself. The 2.6-point move is therefore not a dose-response reading of the tie-break mechanism, and single-seed run-to-run variation stays the plainest available explanation for it.
3. The forecast, scored: three settings, none of them decisive
Everything above measures a mechanism. It does not, on its own, show that mechanism predicts training outcomes. That requires a forecast locked in before training, then checked against what actually happened. This piece has one real attempt at that: run once, single-seed, and built to map the terrain rather than to settle it, a gate-and-composition reading taken on a base model, a prediction written down from it, then a real GRPO comparison between the plain right/wrong checker (the binary verifier in GRPO-style training, RLVR) and a reward model, GRM-Gemma2-2.6B, trained to convergence and scored against that prediction.
One of the three settings turns entirely on how an answer is scored, so it goes first. On closed-book TriviaQA at 0.5B, in the gate-validation run, which is a different experiment from the earlier TriviaQA runs section 5 describes, the checker finished 2.2 points ahead, [0.2, 4.4]. That interval excludes zero, so on the strict scoring the two variants came apart, against a prediction of a tie. Both had learned, 8.7 to 10.9 points over their own untrained baseline. Then a looser scoring, written into the plan before the run and triggered by this exact outcome, was applied: an answer counts if its content is right even when its exact string is not. About 9% of the 2.2-point gap survived it, leaving 0.2 points. The reward-model variant’s answers had also drifted 1.7 tokens terser over training, exactly the kind of change a strict string-match checker reads as a teaching difference. Both facts point the same way, that most of the gap is the reward model reshaping the form of its answers rather than teaching the model less, and that reading comes from one single-seed run rather than a settled mechanism. Which of the two scorings you apply decides whether this setting separated or tied.
The other two settings are the actual test of the theory. One convention governs every gap and interval in this section: each is written as checker minus reward model, so a positive number means the checker ahead and a negative one means the reward model ahead. On GSM8K at 0.5B, where a tie was predicted, the gap came in at +1.0 point, [-3.8, +5.6], both variants gaining 21 to 22 points over base and converging at the same training step. On GSM8K at 1.5B, where the prediction was a moderate reward-model edge of about -2 points, the gap also came in at +1.0 point, [-3.2, +5.2], with the two runs stopping at different step counts (175 and 100). A later re-check on 2,000 questions instead of 500 narrowed both intervals roughly in half (9.4 points wide to 4.8, 8.4 to 4.5), the larger question pool buying more precision on the same two comparisons. The 0.5B pair now reads +2.35 points, [-0.05, +4.75], a lower bound sitting 0.05 points from crossing zero. The 1.5B pair now reads -0.65 points, which is the reward model ahead by that much, [-2.9, +1.6].
What the two GSM8K rows agree on, independent of how any single verdict is scored, is the size of what is at stake: reward choice moved final accuracy by about a single point either way, well inside noise, while the checker and GRM-Gemma2-2.6B each taught the model 19 to 22 points wherever the gate was open enough to let training happen at all. The whole validation, including the recall-task attempt, cost about $12 of cloud compute, cheaper than a single seed of the train-it-twice bet this piece opened with.
| Task / size | Predicted | Measured gap | Interval |
|---|---|---|---|
| TriviaQA, 0.5B | Tie | +2.2 points strict, +0.2 points content-tolerant | [+0.2, +4.4] (strict scoring, n=500) |
| GSM8K, 0.5B | Tie | +1.0 point (n=500), +2.35 points (n=2,000) | [-3.8, +5.6] (n=500), [-0.05, +4.75] (n=2,000) |
| GSM8K, 1.5B | Moderate reward-model edge (about -2 points) | +1.0 point (n=500), -0.65 point (n=2,000) | [-3.2, +5.2] (n=500), [-2.9, +1.6] (n=2,000) |
Measured gaps and intervals are checker minus reward model: positive means the checker ahead, negative means the reward model ahead. The trivia interval belongs to the strict scoring. The content-tolerant pass is a re-score of the same answers, not a second interval.
Read across the three, the forecasts landed like this. The tie predicted on grade-school math at 0.5B held at 500 questions and, at 2,000, moved to a checker lean of 2.35 points whose lower bound stops 0.05 points short of zero: still spanning zero, and only just. The reward-model edge predicted at 1.5B is not established at either pool size, and the point estimate did cross to the predicted side at 2,000 questions, where the interval contains both zero and the predicted 2-point edge. The tie predicted on trivia is the one contradicted at face value, by a gap whose interval excludes zero, and also the one whose contradiction turns on a scoring choice. Both math settings moved when the pool grew rather than settling.
One asymmetry in the scoring belongs on the record. The content-tolerant re-score was run only on the trivia setting, where answers are free text and a truncated string is marked wrong for its form. The math settings are graded on the final number, which already counts an answer wherever in the response it appears and in whatever notation, so the same loosening has no counterpart there and none was run.
The gate reading has been through one scored test so far, in three settings, and no setting came back decisive. Two of them cannot separate the predicted effect from no effect at the precision they were run at. The third turns on which of two defensible scorings is applied. That is not enough to lean on. It is enough to keep going, and section 6 works out what settling the question would cost at two scales.
One prediction, offered and untested
A continuous reward mostly does not have this gate, which offers one further, untested consequence. Re-scoring already-stored math-style rollouts with a trained reward model (Skywork-Reward-V2-Qwen3-0.6B) instead of the checker collapsed the shut-gate rate from 22.3-57.2% under the checker to under 1% under the reward model, on the same stored sequences, because a continuous number rarely lands on exactly the same value twice, where a binary label folds many different wrong answers into the same 0. If the gate is really the channel scale acts through, tasks graded by a continuous judge instead of a checker, where the gate is already mostly open, should show little to no crossover as you scale up: a richer signal should look however good or bad it looks at the smallest scale you can afford and stay close to that. This is offered as a falsifiable consequence of the gate story, not a second finding: it has not been tested against any trained outcome.
4. Seed noise, measured, and what it costs to beat
Two things are set at random before a training run starts: where the weights begin and the order the data arrives. Change the seed and the final model differs, everything else held fixed.
A separate experiment in this program measures exactly how much that matters. Same Qwen2.5-1.5B model, same GRPO recipe, on the Dolly instruction-following dataset: 3 independently seeded runs each trained one policy against GRM-Gemma2-2.6B’s full reward signal and a matched twin against the same reward model with half its signal replaced by random noise every step. The three runs differ only in seed. Two judge models, fsfairx and mistral, then scored both final policies head-to-head on one fixed set of 325 held-out questions, drawn once and put in front of every seed unchanged.
Two different numbers can come out of the same seed, and it matters which one you read. Tallies are the raw win, loss, and tie counts a judge casts. Scores are the judge’s own continuous number for each attempt, and a length-residualized score corrects that number for something correlated with it, here answer length, before counting a win. The correction is a simple regression: fit
score_diff = beta0 + beta1 x length_diff
across every scored pair, then judge each pair on its residual (its score difference with the length-predicted component removed) rather than its raw score difference. Fit on this program’s own data (fsfairx judge), beta1 = 0.0035 with R-squared = 0.37, meaning every extra token of length predicts 0.0035 more raw score-difference, and length differences explain 37% of the variance in raw score differences. Worked example: two attempts differ by 0.05 in raw score, and the reward-model-scored one also ran 20 tokens longer. Length alone predicts 20 x 0.0035 = 0.070 of that gap, more than the whole observed difference, so the residual is 0.05 - 0.070 = -0.020: once you remove what length alone would predict, this attempt actually looks worse, not better. That is why the same seed can flip sign between the two analyses.
| Seed | Raw tally (GRM wins-losses-ties) | Residualized tally (wins-losses-ties) | Residualized p |
|---|---|---|---|
| 1 | 185-57-83 | 131-87-107 | 0.0035 |
| 2 | 106-109-110 | 83-108-134 | 0.082 |
| 3 | 202-41-82 | 145-68-112 | <0.001 |
p is an exact two-sided binomial test on the decided (non-tied) votes per seed, the pre-registered primary analysis (fsfairx judge).
The two-part rule this piece holds itself to is the one stated at the top, and both halves of it do work here. Across the same 325 questions, pool the three seeds question by question, take the majority verdict on each one, and test that tally: 147 questions favor the intact signal against 104 for the noise-injected twin, with 74 undecided, a split at least this uneven being one a fair coin produces about 8 times in a thousand (p = 0.0079). That clears the significance half on its own. The second half asks every seed’s own direction to agree with the majority, and seed 2’s does not. The rule calls no winner, and the pooled number is exactly what the second half exists to stop anyone reporting by itself.
On the raw tally, seed 2 reads as a near-exact coin flip, 106 to 109. On the residualized reading, that same seed leans the other way, 83 to 108, favoring the noise-injected twin. The measurement carries its own imprecision, and the size of it is knowable. Each seed’s tally is one judged pass over the same 325 questions and inherits that pool’s sampling error, and seed 2’s lean sits inside that error rather than outside it, which is what its p = 0.082 says. What the sampling error does not cover is the distance between that seed and the other two, which land on the opposite side at p = 0.0035 and p < 0.001. Three runs that differ only in seed came apart further than the instrument reading them wobbles.
This can be costed the way an engineer costs a manufacturing tolerance. A $0 re-analysis of this data split the uncertainty in a pooled 3-seed verdict into 3 pieces: how much comes from which seed you drew, how much from how many test questions you checked against, how much from disagreement between judges. At this one measured scale, the seed piece is about 12.4 times larger than the test-question piece and roughly 1.1 million times larger than the judge-disagreement piece, and the current 3-seed pooled margin of error sits at 7.25 percentage points. Spending the next $5 on a fourth seed plus a few hundred more test questions cuts that margin to about 6.2 points. Spending the same $5 entirely on test questions barely moves it, to about 7.1 points, because test-question noise was never where the disagreement was coming from. One boundary on this advice: it concerns the plain pooled margin, the width of the combined verdict, and nothing else. The two-part rule puts the sign condition on top of that margin, and under both conditions at once the arithmetic changes. Each added seed sharpens the pooled test and at the same time makes agreement in direction harder, because a new seed is one more chance to point the other way and its own precision is set by the question pool rather than by how many seeds there are. The two effects mostly cancel, so seeds stop paying after the third, while growing the question pool shrinks every seed’s own noise directly and keeps paying. The fuller cost accounting, including the per-dollar ranking across seeds, test questions, and judges, is worked out in a companion piece published alongside this one, “Same RL Recipe, Different Seed, Different Verdict: Here’s a Training Comparison You Can Trust.” This section keeps only the ratio the gate story needs.
One number here is a measurement, and one is a design constant, and they should not be confused with each other. The 6-point margin used in section 2 is not measured seed variance. It is standard power arithmetic, computed and locked in before training started: at n = 500 held-out questions and roughly 50% base accuracy, the standard error on the difference between two variants is
SE = sqrt(2 x 0.5 x 0.5 / 500) ≈ 0.03 (about 3 percentage points)
and 2 standard errors of headroom, the usual bar for calling a gap real rather than noise, is about 6 points. The 7.25-point figure above is a different, measured quantity: the actual pooled margin of error this program’s own 3-seed Dolly runs achieved, on a different task, at a different point in training.
Connect this back to the optimizer comparison the piece opened with, where scale-aware studies of the same optimizers land anywhere from a steady 2x speed advantage down to none at all (arXiv:2512.05620). Nothing measured here settles that literature. What it offers is a cheaper candidate explanation to rule out first: if a comparison run at a single seed there carries anything like the seed spread measured in this section, disagreement of that shape can arise with no scale-transfer effect at all. Whether the seed-noise term itself shrinks, holds steady, or grows as models get bigger has not yet been measured. That is exactly the next experiment section 6 puts a cost on.
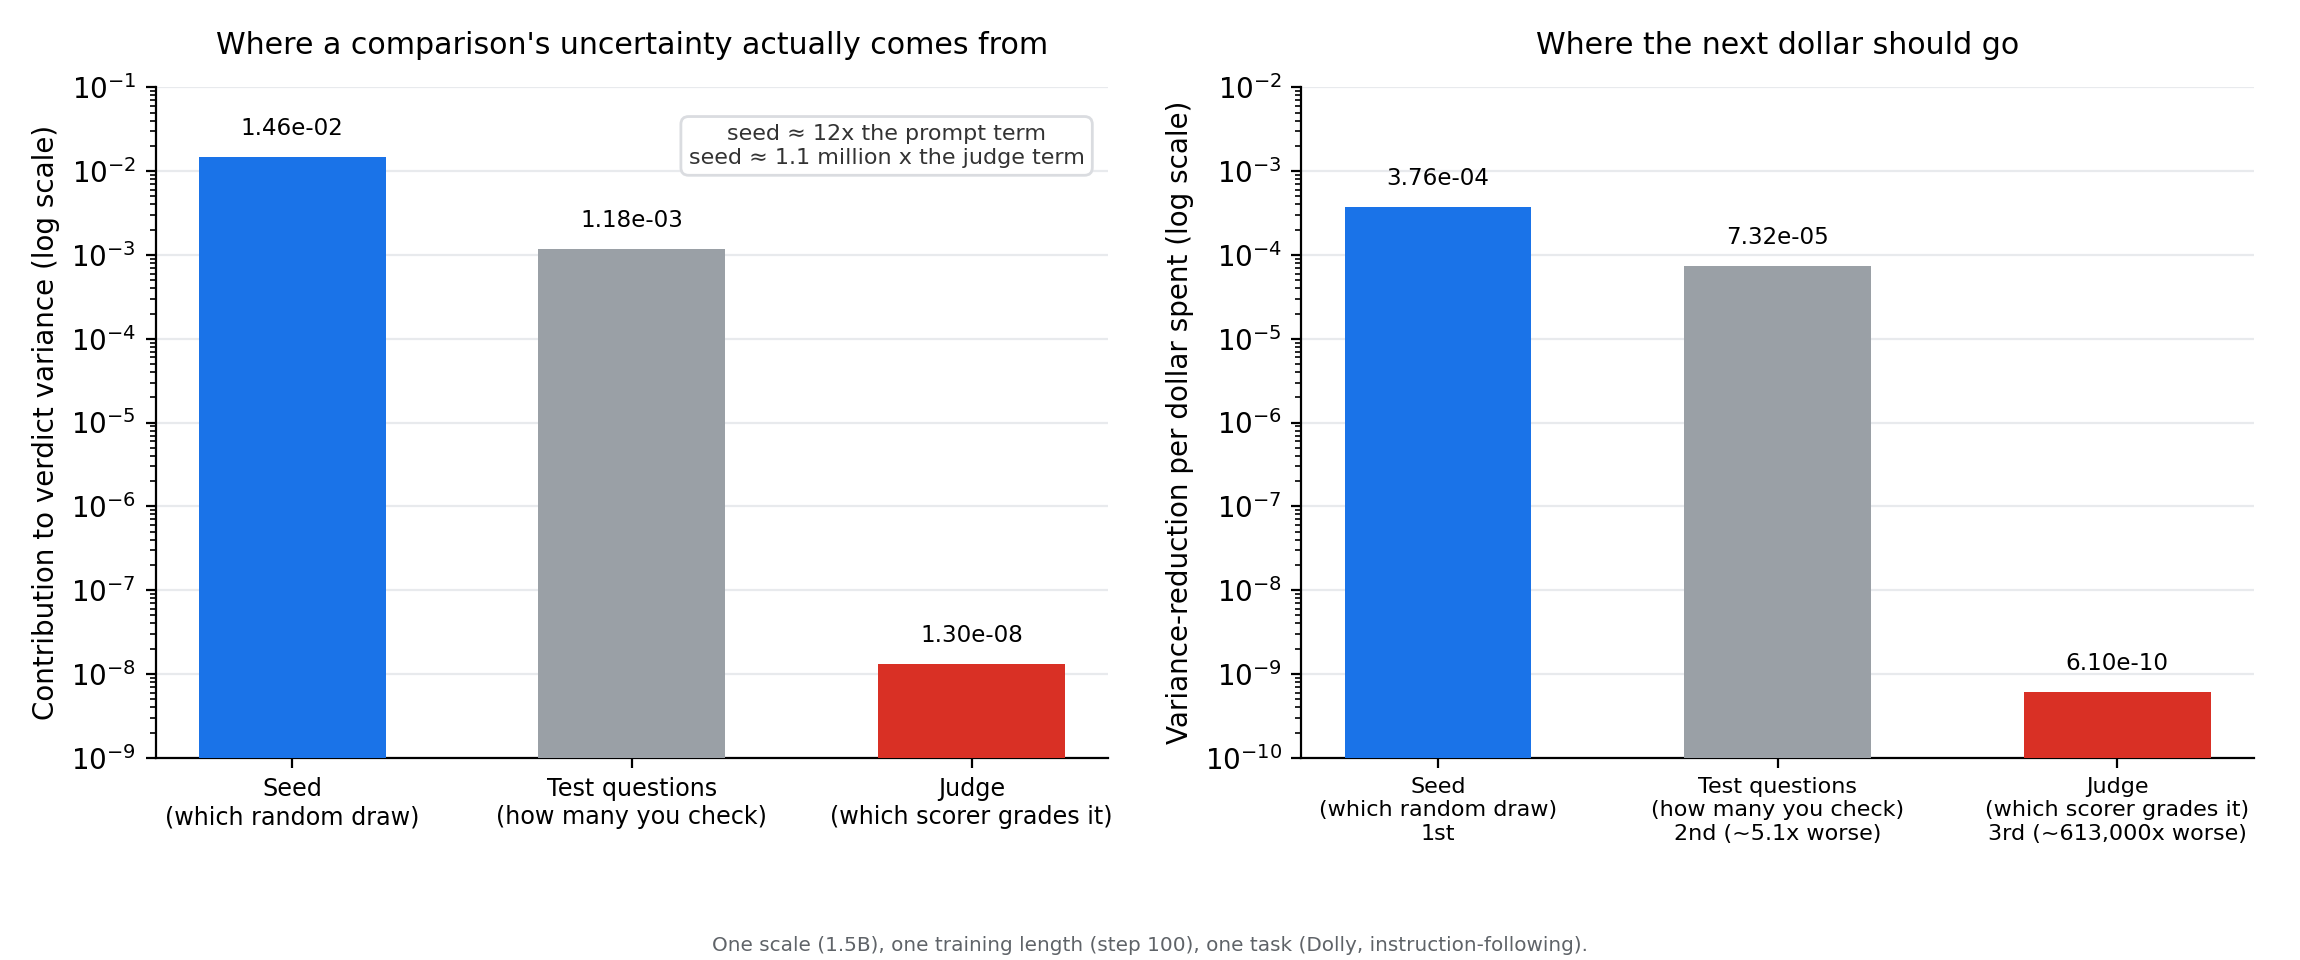
One more seed beats more test questions beats more judges, by orders of magnitude, at the one scale this has been measured.
5. Ignorance or unreliability: two reasons a gate stays shut
A shut gate on a recall question and a shut gate on a math question can look identical in the count and mean something different underneath. Answering “who is the Norse god of thunder” is closer to a light switch than a dial: either the fact sits in the model’s weights and comes out, or it does not, and no amount of resampling finds it. A shut gate here, all 8 attempts landing the same way, is mostly a tie of ignorance. Getting a multi-step math problem right depends on which path the model takes, where a digit gets dropped, which step goes sideways: the same underlying competence can land right on one attempt and wrong on the next. A shut gate here is more often a tie of unreliability, the correct chain reachable but not landed on consistently, which is exactly the kind of gap reinforcement learning is built to close.
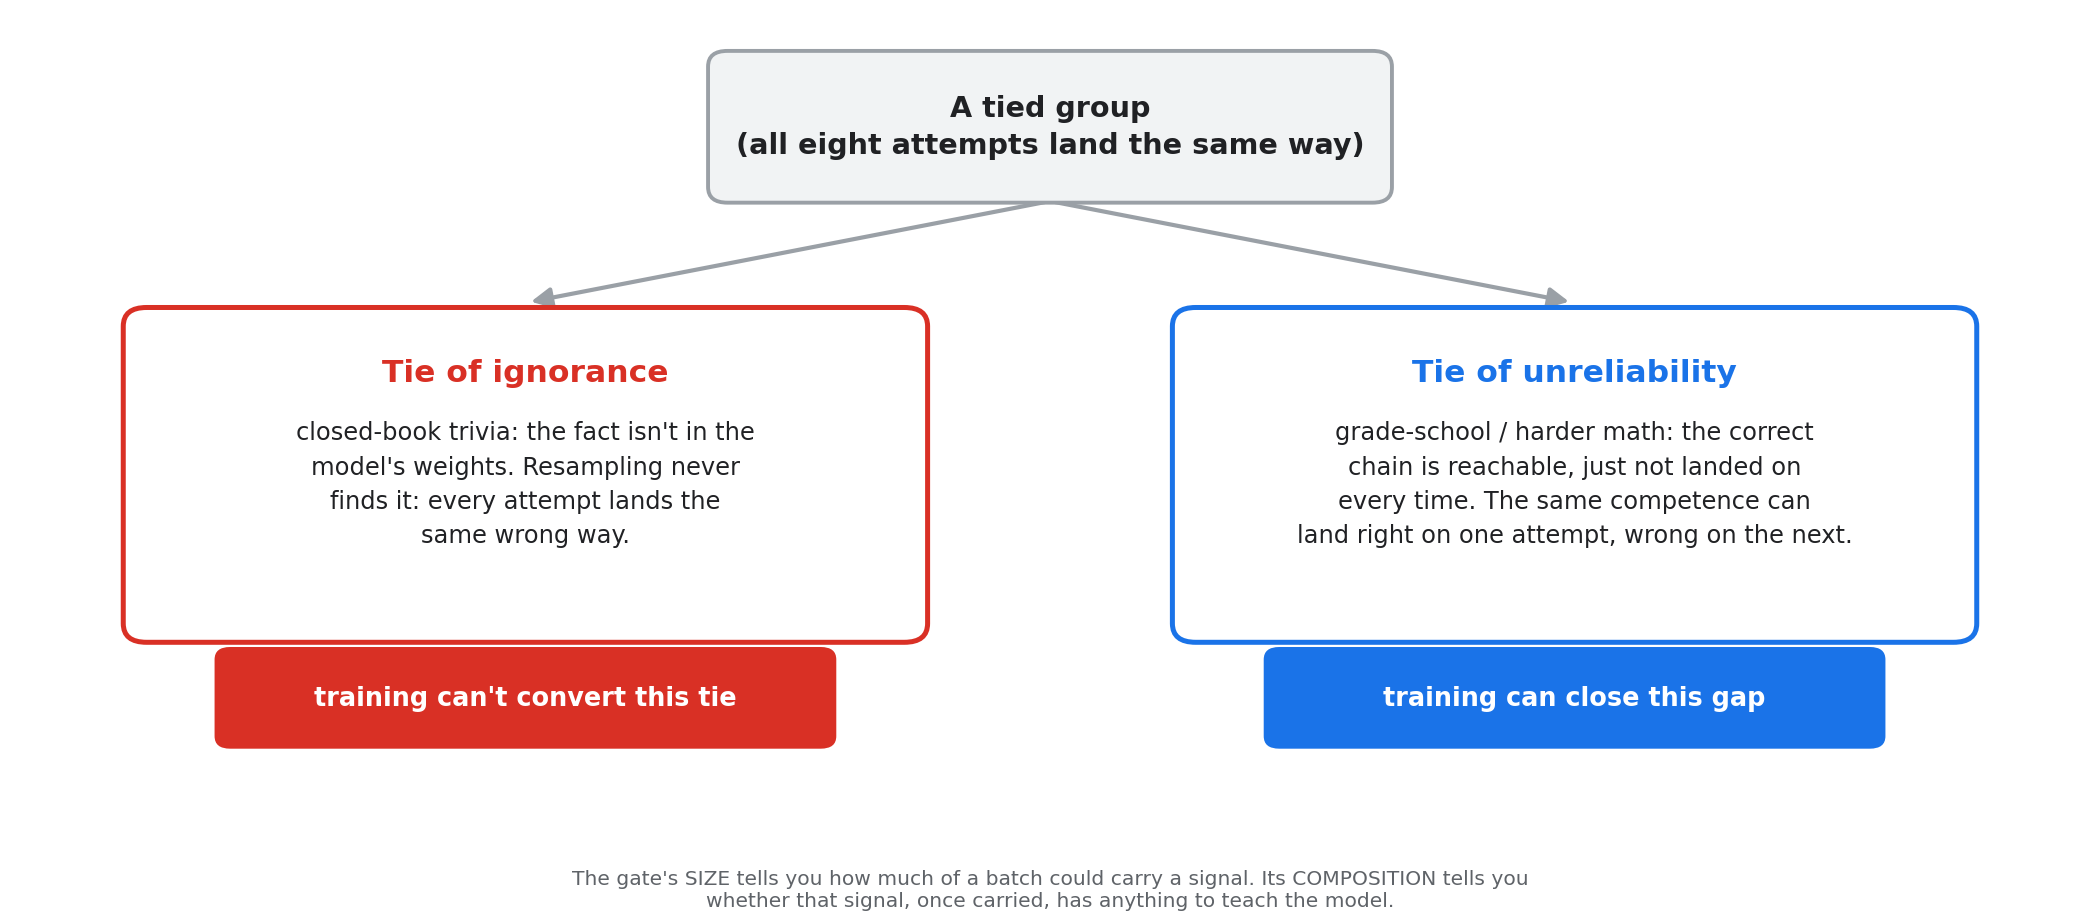
A shut gate’s size tells you how much of a batch could carry a signal. Its composition tells you whether that signal, once carried, has anything to teach the model.
This program’s own numbers back the split, and they cut both ways. Two different TriviaQA experiments sit behind what follows, and they say different things. The earlier pair of runs (0.5B and 1.5B, sampling temperature 1.2, 175 training steps) held at its base rate across every measured checkpoint under all three rewards, including the plain right/wrong checker (the binary verifier in GRPO-style training, RLVR). That pair carried no measured baseline at step 0 and its first checkpoint already sat at base rate, which leaves its gate measurement as the part worth leaning on and its accuracy trajectory as the part that cannot decide anything: “no learning” cannot be cleanly separated there from “a small early bump then flat.” The later gate-validation run is a different experiment, at 0.5B only, stopped at 100 steps, and in it both variants did learn: the checker by 10.85 points over its own untrained baseline [8.2, 13.7] and the reward model by 8.65 points [6.1, 11.3]. Both sampled at the same temperature, 1.2. What differs is the training horizon (175 steps against 100), the model sizes covered (both against 0.5B alone), the setup each ran on, and the baseline each was measured against, since only the later run measured its own untrained starting point and its own base-model tie count. They are separate experiments rather than two readings of one, and no gap between them is worth computing.
That means the ignorance reading rests on composition rather than on any learning null. In the later run’s own base-model count of the exact questions it went on to train against, the trivia gate read 0.7700 [0.7311, 0.8047], and every tied question in it was tied all-wrong, with zero questions tied all-right. Pure fact-ignorance ties, no mastery ties at all, which is the signature the split predicts for a recall task and is evidence in a way that a flat training curve is not.
On the harder math task the count reads 61.7% all-wrong, and it needs its scope attached to be read at all. It is a share of sampled groups rather than of questions: four training variants each made a single pass over the same 480 questions, and the 61.7% pools all 1,920 of those groups. The training runs beside it cannot carry an ignorance reading on their own. No variant there separated from its own untrained accuracy of 0.203. The four finished between 0.190 and 0.211, and at 384 evaluation questions one standard error is 2.05 points, so every one of those gaps sits inside a single standard error. That configuration also ran 60 steps on a reduced budget, and the fuller configuration the task was originally scoped for was never run. This task is therefore in the same position as the earlier trivia pair: “no learning” and “too little training to tell” cannot be separated here, and what the run contributes is its count of ties, not a verdict on what reward choice did.
On grade-school math the comparable count is a base-model one, taken question by question before any training rather than pooled across a training run: all 8 draws came back wrong on 48.4% of questions at 0.5B and on 19.2% at 1.5B, falling with scale.
Restricting to just those all-wrong-tied GSM8K questions and giving each 24 more draws (32 attempts total per question) shows the stuck share falling with scale too, from 47.1% at 0.5B to 27.1% at 1.5B, [38.4, 56.0] against [16.6, 41.0], intervals overlapping only in a narrow 38.4-41.0 band. Scale is converting a real share of ignorance-looking ties into unreliability as the model gets bigger, though not yet a clean statistical separation at this sample size. It is exactly on this easier, unreliability-leaning task that the 3 reward-model variants in section 2 all landed above the checker. That ordering is not evidence for the split. Every one of those gaps sits inside the roughly 6-point margin a single-seed run cannot resolve, part of the gap is the mechanical batch-dilution effect section 2 names, and the epsilon sweep in the same section points the other way. What the split actually predicts is narrower and still untested: where a mixed group reflects a reachable chain rather than a knowledge boundary, a better-ranked reward such as GRM-Gemma2-2.6B has something it could teach. Whether it does is what a properly seeded comparison would have to settle.
Behavioral resampling like this has a specific scope. It does not prove a fact is absent from the model’s weights. It establishes that the model’s success probability, at that sampling temperature, sits below roughly one in however many tries were spent, a floor on the evidence, not proof of ignorance. For a closed-data model like the ones used throughout this piece, that behavioral floor is also the strongest evidence available. The stronger version, checking whether a fact ever appeared in the training corpus itself, needs an inspectable corpus, which these models do not offer. Section 6 names the concrete path to that stronger check as future work.
External evidence bears on this split too, and it complicates any clean two-bucket story. Simple self-distillation (SSD, “Embarrassingly Simple Self-Distillation”, arXiv:2604.01193) fine-tunes a model on its own unverified, high-temperature samples, no external verifier involved, and lifts pass@1 from 42.4 to 55.3. Their pass@5 gains exceed their pass@1 gains, and a training corpus that was 62% gibberish by their own count still helped. That is training moving a model’s output distribution, with no new facts and no verifier in the loop, which argues that at least some of what a shut gate blocks is reachable by reshaping what a model already has, not only by teaching it something new. Whether SSD’s gains land on ignorance-looking ties or unreliability-looking ties in this program’s own sense is a designed, not-yet-run measurement: an open question, not a claim this piece settles. One instrument rider applies to all of this: when a practitioner claims a model “can” or “cannot” do something, that claim almost always means pass@1, so pass@k evidence like SSD’s needs its own translation before it speaks to a practitioner’s claim.
6. What settling it costs, at two scales
At the scale this piece works at, 3 concrete steps would move the gate hypothesis from suggestive to something closer to trustworthy. Step one, the base-model gate curve in section 1, is already done, at about $1.55. Step two, measuring the seed-noise term at a cheap-to-repeat scale by running the checker-versus-reward-model comparison 3 to 4 times with only the seed changed, costs roughly $15 to $25, based on this program’s own observed marginal costs ($8 for a matched 0.5B-and-1.5B TriviaQA pair, $10-12 for a four-variant GSM8K run, about $3.50 per seed). Step three, repeating that seed-noise measurement once at a second, larger size, the step that would show whether seed noise shrinks, holds, or grows with scale, costs another $15 to $25. All in, $20 to $60, well under the cost of a single large training run.
That range is enough to decide whether this piece’s own gate story is worth trusting further at the scale it was measured on. It is not enough to make the result citable to a skeptical reader, because every number above comes from one model family capped at 1.5B parameters. Repeating the same 3 measurements at a 7B-class model costs more in proportion to the parameter count: 7B against the 1.5B these figures were measured at is a factor of about 4.7, which puts the same work at about $95 to $280. That is what a skeptical reader has the right to demand at the 7B-class tier.
| Scale tier | Cost | What it decides |
|---|---|---|
| This piece’s own scale (0.5B-1.5B) | $20 to $60 | Whether the gate story is worth trusting further at the scale already measured |
| 7B-class scale | About $95 to $280 | Whether the mechanism holds at a scale a skeptical reader would find citable |
One further limit runs through every number in this piece. None of the base models (Qwen2.5-0.5B, Qwen2.5-1.5B) or third-party reward models (GRM-Gemma2-2.6B, the Skywork-Reward-V2 variants) expose an inspectable pretraining corpus, so prior exposure to GSM8K, MATH, TriviaQA, or Dolly cannot be ruled out, and any such exposure would inflate rather than shrink the reported edge. An open-data model family such as OLMo, whose training corpus can be searched directly, is the concrete path to checking this and to the behavioral-floor question from section 5: infini-gram is a suffix-array index over a trillion-token corpus that answers whether a given text appears in it (arXiv:2401.17377), and AI2’s OLMoTrace tool traces a model’s answer back to the training documents it came from. A related study already runs exactly this pairing, corpus-exposure checks combined with behavioral non-extractability, to isolate unseen facts in a controlled experiment (arXiv:2511.05933). An older lineage probes what a model states as fact through cloze-style querying instead of checking its training data (Petroni et al. 2019, surveyed in arXiv:2310.16570). Both tiers of spend above, and this open-data check, are named as future work, not yet run.
7. Limits
Every shut-gate rate in this piece is a single-seed reading. Every measurement comes from one model family, Qwen2.5, adapted with LoRA rather than a full retrain. The pre-registered forecast in section 3 has an n of 3 comparisons, not enough to generalize beyond itself. The free prediction about continuous-judge tasks in section 3 is offered and untested against any trained outcome. The 6-point margin used in sections 2 and 4 is a design constant, computed from standard binomial arithmetic before training started, not a measured seed variance, and should not be confused with the 7.25-point figure that is.
Per-run records, evaluation outputs, and analysis scripts for every measurement in this piece are archived in the project’s repository. Available on request.