What this piece found
- We built our own ranking of 7 reward models by how well they judge finished answers, the way public leaderboards do, and then trained real models against them. Across 3 training tests that ranking’s order never showed up. In two, nothing was learned at all, so there was no order for the ranking to predict. In the one run that learned, the order inverted: the model our ranking placed fifth of seven produced the best trained model (59.0%) while its top-ranked model finished behind it (55.2%).
- The reason is structural. The training method (GRPO-family reinforcement learning) learns only when its sampled attempts at a question receive different grades. With a right/wrong checker, large fractions of attempt groups get the same grade on every member: no learning signal at all, whichever reward model you bought. On a closed-book trivia run at 1.5B parameters, a separate run from the three training tests above, 59.7% of groups carried no signal a quarter of the way into training.
- Making those all-same groups informative is cheap at inference time: rescoring a pool of 131,200 stored attempts with a 0.6-billion-parameter reward model cost about $0.60 of rented GPU time, at roughly a dollar an hour. The expensive question is trust. A scorer that a training run is actively learning to please can drift or be gamed, and that risk, not compute, is why checkers stay popular.
- Before committing a training budget, a 5-step pre-check on your own data, most steps free and none over a few dollars, tells you whether your setup is one where reward choice can matter at all.
1. The ranking that did not survive contact with training
Training a model this way works like a coach who never explains form, only calls one attempt at a question better than another. Give the model one question. Let it try eight separate times, each attempt a little different because there is randomness in how it writes. Score every attempt, then compare only within that one group of eight: nudge the model’s weights toward whichever attempts scored better than their groupmates, and away from the ones that scored worse. Do that across thousands of questions, and that is the whole training loop.
This is GRPO, group relative policy optimization: sample a group of attempts, score them, nudge the model toward the group’s own better half. The plainest possible way to run that scoring is a checker, a program that reads an attempt and says right or wrong, nothing in between. Training against nothing but a checker’s yes-or-no verdict is called RLVR, reinforcement learning from verifiable rewards, and it is the setup behind most of today’s open reasoning models. A reward model swaps that stamp for a second, separately trained model that reads the same attempt and hands back a continuous score, a graded sense of how good the attempt looked, even among the ones that were technically wrong.
Public leaderboards rank reward models on exactly that continuous-scoring job: grade a finished answer, check the grade against which answer was actually correct, and score how much better than random guessing the reward model’s ordering is. We built our own ranking of that kind rather than borrowing one, so that the same models could be carried straight into training with nothing changing underneath. Call the measure capture%: the share of the distance from a coin flip to a perfect grader that the model covers, so 0% means coin-flip grading, 100% means perfect, and every reward model lands somewhere between. Seven off-the-shelf reward models were scored this way, on our own held-out answers, on two kinds of question: factoid trivia and science questions. The ranking is read per question set, not as one blended figure, because whether a reward model earns its inference cost depends on the task, and one average across two tasks buries that. Skywork-Reward-V2-Qwen3-8B finished first, covering 77.90% of the distance on trivia and 58.48% on science questions. GRM-Gemma2-2.6B finished fifth of the seven, at 59.77% and 32.54%. Skywork leads on both, by 18.1 and 25.9 points. Averaged across the two sets those come to 68.19% and 46.16%, the pair of numbers most often quoted from a board like this one, and the pair that hides the task dependence.
What the ranking does not establish is that any particular pair on it is reliably apart. Re-draw the scored answers and re-rank, which is how you find out how much of an order is sampling luck, and no pair of neighbors on the board comes out separated. This pair does not come out reliably apart either. The order is a real point estimate, and a point estimate is all it is. Every “the ranking said” in this piece means that measurement, not a published board’s.
That ranking answers a grading question. Training asks a teaching question: hand a reward model’s score to a training run, thousands of times over, as the actual signal that reshapes the model’s weights, and see what the resulting policy can do. We ran that test three times.
Twice, on a closed-book trivia task at two model sizes (Qwen2.5-0.5B-Instruct and Qwen2.5-1.5B-Instruct), training did not learn anything at all. Every run, whichever reward it used, sat flat at its starting accuracy for the whole run, checker and reward model alike landing within a point of the model’s own base rate: 15.2% (checker), 13.6% (GRM), 13.6% (Skywork) at 0.5B, and 35.6% (checker), 35.0% (GRM), 34.8% (Skywork) at 1.5B. The model’s stock of first-try-correct answers on this task was too thin at both sizes for any reward to have much to rank. That is a real finding in its own right, but it also means these two tests compare a null against a null. If nothing is learning, there is no ranking for a judging score to predict, and no failure to blame on our own ranking either.
The third test is where the policy actually learned. We moved to grade-school math (GSM8K), where the model already gets roughly half its first attempts right, enough correct and incorrect attempts mixed into the same group of eight that a reward has something to rank. Trained three ways, at 1.5B: a plain checker, and the same two reward models our judging ranking placed four rungs apart, Skywork-Reward-V2-Qwen3-8B and GRM-Gemma2-2.6B.
Our judging ranking’s order came out inverted. GRM-Gemma2-2.6B, the ranking’s fifth-place model of seven, finished the training test on top, at 59.0% accuracy. Skywork-Reward-V2-Qwen3-8B, the ranking’s number one, finished at 55.2%, behind the model the ranking said it beat, and closer to the plain checker’s 53.6% than to the winner. Only the checker finished lower.
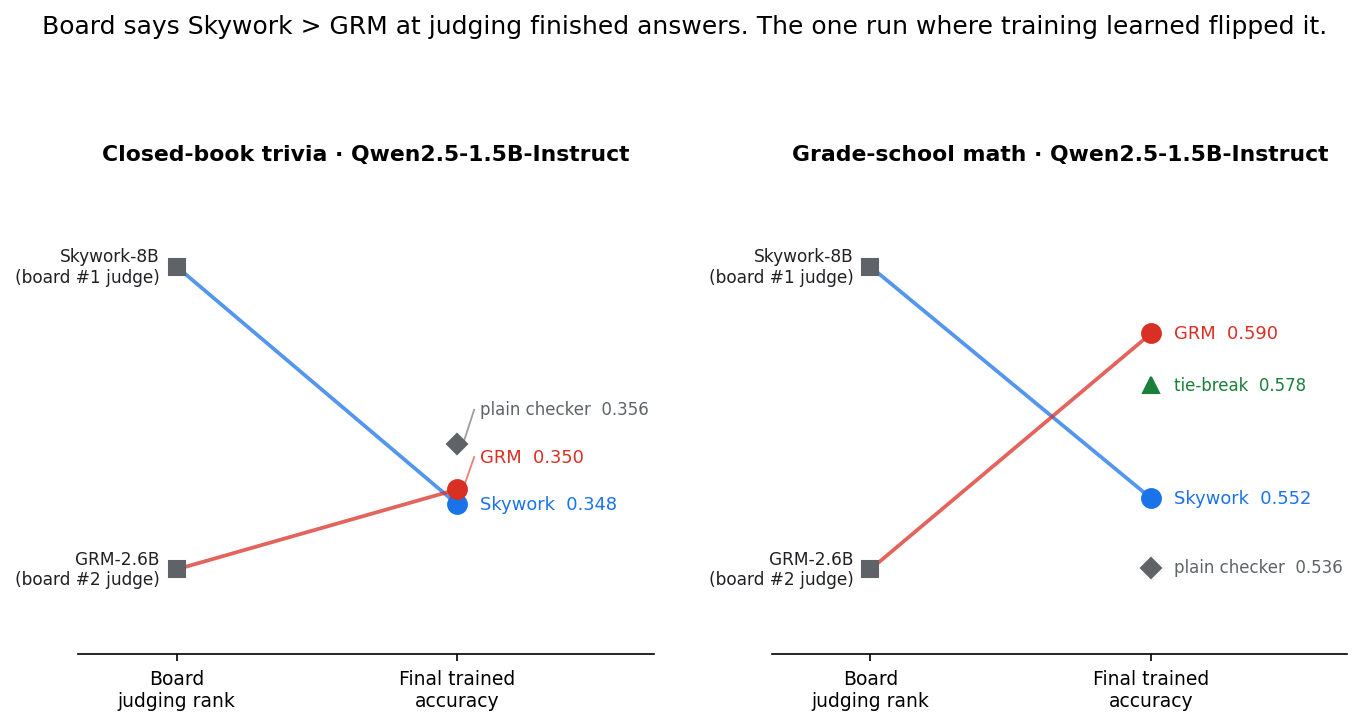
Notice: the trivia panel here is a null against a null (checker, GRM, and Skywork all sat flat at the model’s starting accuracy), shown once for the scale pictured. The grade-school-math panel is the real test, and it is where our ranking’s order (Skywork over GRM) came out inverted in training (GRM over Skywork), from a single training run apiece.
This gap between judging rank and training payoff is an active question elsewhere too: Preference Proxy Evaluations (Frick et al., arXiv:2410.14872), RewardBench 2 (Malik et al., arXiv:2506.01937), and Kim et al. (arXiv:2505.12763) all report that a reward model’s benchmark rank predicts little about the policy it trains, and Eisenstein et al. (arXiv:2312.09244) trace a mechanism for it: reward models that agree in-distribution can diverge sharply once training shifts the distribution underneath them. What these three tests add is narrower: three concrete instances of that gap, on our own model and tasks, and a protocol below to check it on yours.
At this scale, two of these numbers need to differ by about 6 percentage points before the gap survives what one seed alone can tell apart, so read 59.0% versus 55.2% as “the judging ranking’s order did not show up here,” not as a confirmed 3.8-point win. Two more limits apply to all three tests. They were matched on step count, not on compute: scoring with the larger reward model cost about 54% more wall-clock time reaching the same step count here, a serving-setup cost that a separate, faster pipeline measured later did not reproduce (there, all three reward choices landed within about 4% of each other). And every run stopped at 100 to 175 training steps, short of the point where an order that has not yet crossed could still cross.
A judging ranking, ours or anyone’s, measures how well a reward model grades finished answers. Training asks a different question: what does optimizing against this signal, group by group, actually teach? The next section is why those two questions come apart.
2. Why judging rank does not transfer: most groups teach nothing
GRPO, the training method from the last section, learns only from disagreement inside one group of sampled attempts at the same question. Before it can learn anything, it turns each group’s raw scores into an advantage by centering and rescaling them within that group, worked out on a real group further down this section. A group where every attempt scored exactly the same produces an advantage of zero for every attempt in it, nothing to nudge toward and nothing to nudge away from, no matter which reward model does the scoring. Call a group like that dead.
We measured how often that happens on a real training run: trivia questions, Qwen2.5-1.5B-Instruct, eight attempts per question, graded by a plain checker (GRPO’s binary right-or-wrong verifier, the RLVR setup from the last section). It was not rare. Nearly six groups out of ten, 59.7%, came back completely tied a quarter of the way into training. That reading is from an earlier trivia run of the same shape as the three tests above, a separate run, which is why the number differs from the end-of-run silence rates quoted below. Getting agreement was not hard. Getting variety in the grade was harder.
Here is what that looks like on a real GSM8K attempt, before any training had reshaped the model at all. Eight attempts at a grade-school math problem about lost laundry, all eight wrong, all eight graded a flat 0 by the checker, a dead group:
“…3 - 3x18 = 27- 54 = 47 clothes lost. The answer is 47.” Checker: 0 (wrong) · reward model: -1.78
“…30 shirts and sweaters remaining. This means 27 - 30 = 3 items are missing.” Checker: 0 (wrong) · reward model: +2.01
Both wrong, and the checker cannot tell them apart (zero and zero), but the reward model spreads them almost 4 points apart on its own scale, real disagreement a checker cannot produce.
The instinct, reasonably, is to force more variety into the batch of attempts rather than change how they’re graded. We tried two ways of doing that, on the same kind of task, and both ran into the same wall.
Keep drawing until the group has a mix of right and wrong: instead of stopping at eight attempts, sample up to 4 times the normal budget, the way a recent method called Reinforce-Ada (arXiv:2510.04996) does. On this task, that extended search hit its own ceiling and gave up empty-handed on two-thirds of the questions (66.9%) even with 4 times the draws to work with. The model was not withholding a mixed group that a bit more patience would surface. On most of these questions, it simply did not have one to give.
Force the text of each attempt to be different, then correct for it: sample without replacement, actively steering the batch away from repeating the exact same words, using a statistical reweighting trick (the Horvitz-Thompson correction) to keep the training signal unbiased despite the forcing. Run on a harder task, one where getting the answer right takes several dependent reasoning steps rather than recalling a single memorized fact (grade-school math worked out step by step, instead of trivia recall), this does what it is built to do: it makes the words different. It does not make the grade different. Even after forcing eight attempts to use eight different wordings, 67-72% of the time every single one still landed on the same right-or-wrong verdict. That range covers three sampling temperatures, 0.6, 0.8 and 1.0. A fourth setting, 1.2, is left out of it: at that temperature 38.5% of the attempts came out too incoherent to pull an answer from at all, far past what the rest of the sweep had to contend with.
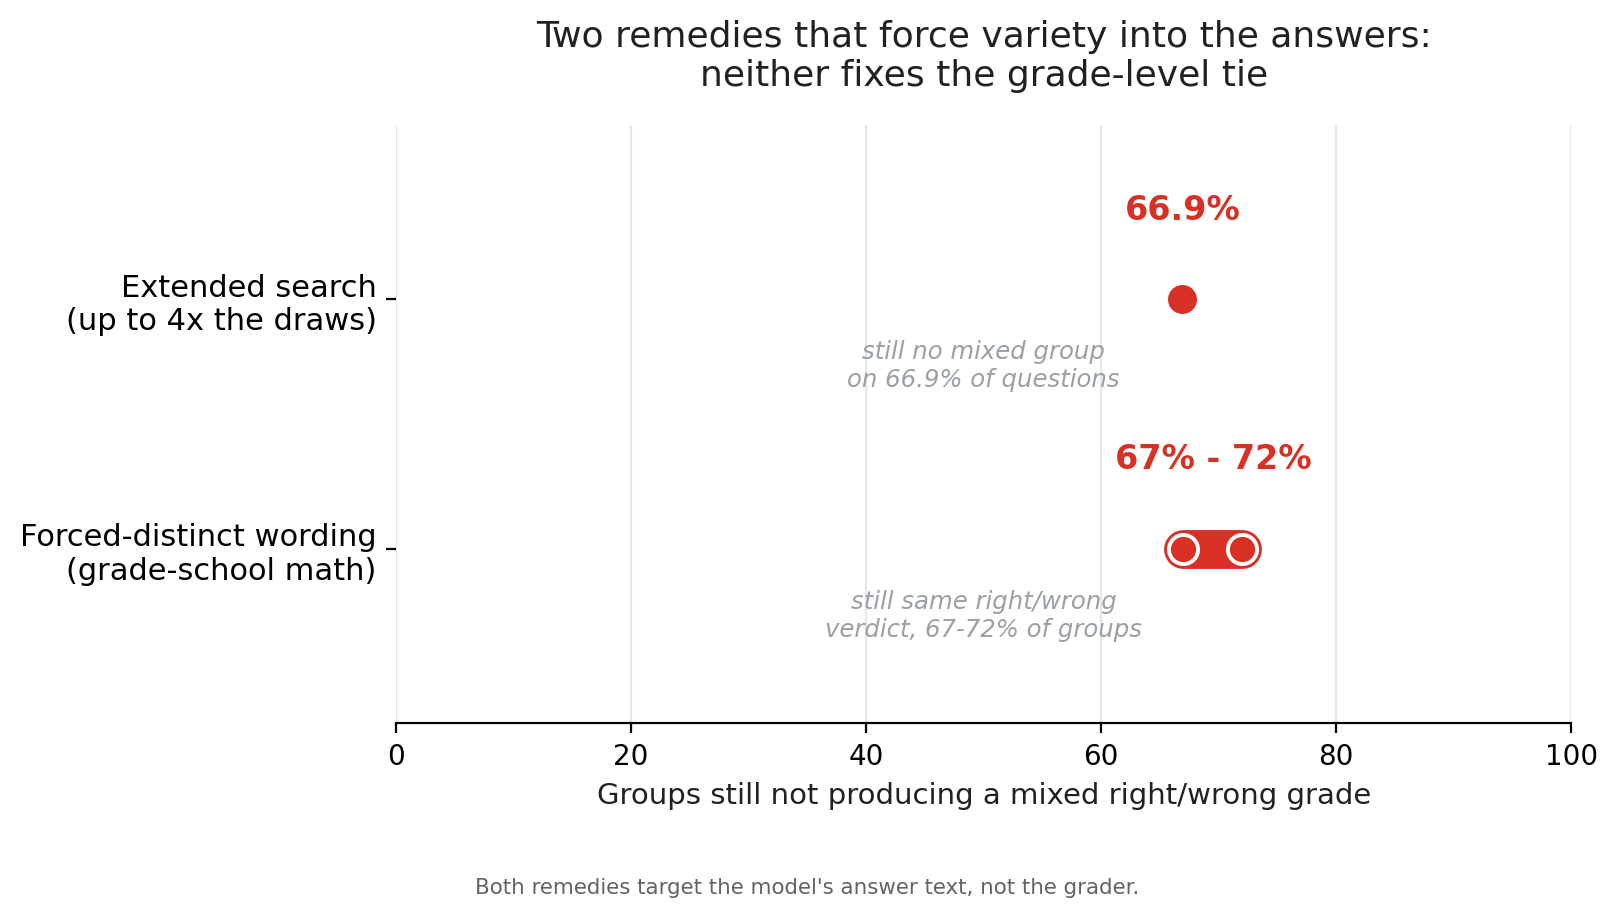
Both remedies chase variety in the model’s answers. There is a second knob neither one touches: variety in the grade. Take the exact same stored rollouts (no resampling, no retraining) and re-grade them with a reward model instead, a continuous score in place of the flat yes/no:
| What we measured | How it was graded | Tied-group rate |
|---|---|---|
| Grade-school math, 300 questions, 4 sampling temperatures | Yes/no exact match | 22% to 57% |
| The same rollouts, re-scored | Continuous reward-model score | 0% to 0.9% |
That 22% to 57% is a range across sampling temperature, not across anything else: 33% at temperature 0.6, 22% at 0.8, 26% at 1.0, and 57% at 1.2. It does not climb steadily with temperature. It dips and then jumps. Three tied-group numbers appear in this piece and they are easy to mistake for each other, so here they are side by side. The 22% to 57% above is the share of 8-attempt groups that came back all one grade, measured offline on stored draws, swept across temperature. The “about 21%” that section 4 quotes for grade-school math is that same share of groups measured live inside the training run, which sampled at temperature 0.8, which is why it lands at the bottom of the range rather than the middle. The 67% to 72% just above is a different quantity altogether: among attempts that were forced to come out textually distinct, the share that still carried the same grade. It answers “did forcing different words produce different verdicts,” not “how many groups are dead.”
Ties did not get rarer. They nearly stopped existing, from as high as 57% of groups down to under one in a hundred, on the exact same generations. Nothing about the model’s diversity changed. Only the ruler changed, from one with two marks on it to one with a thousand.
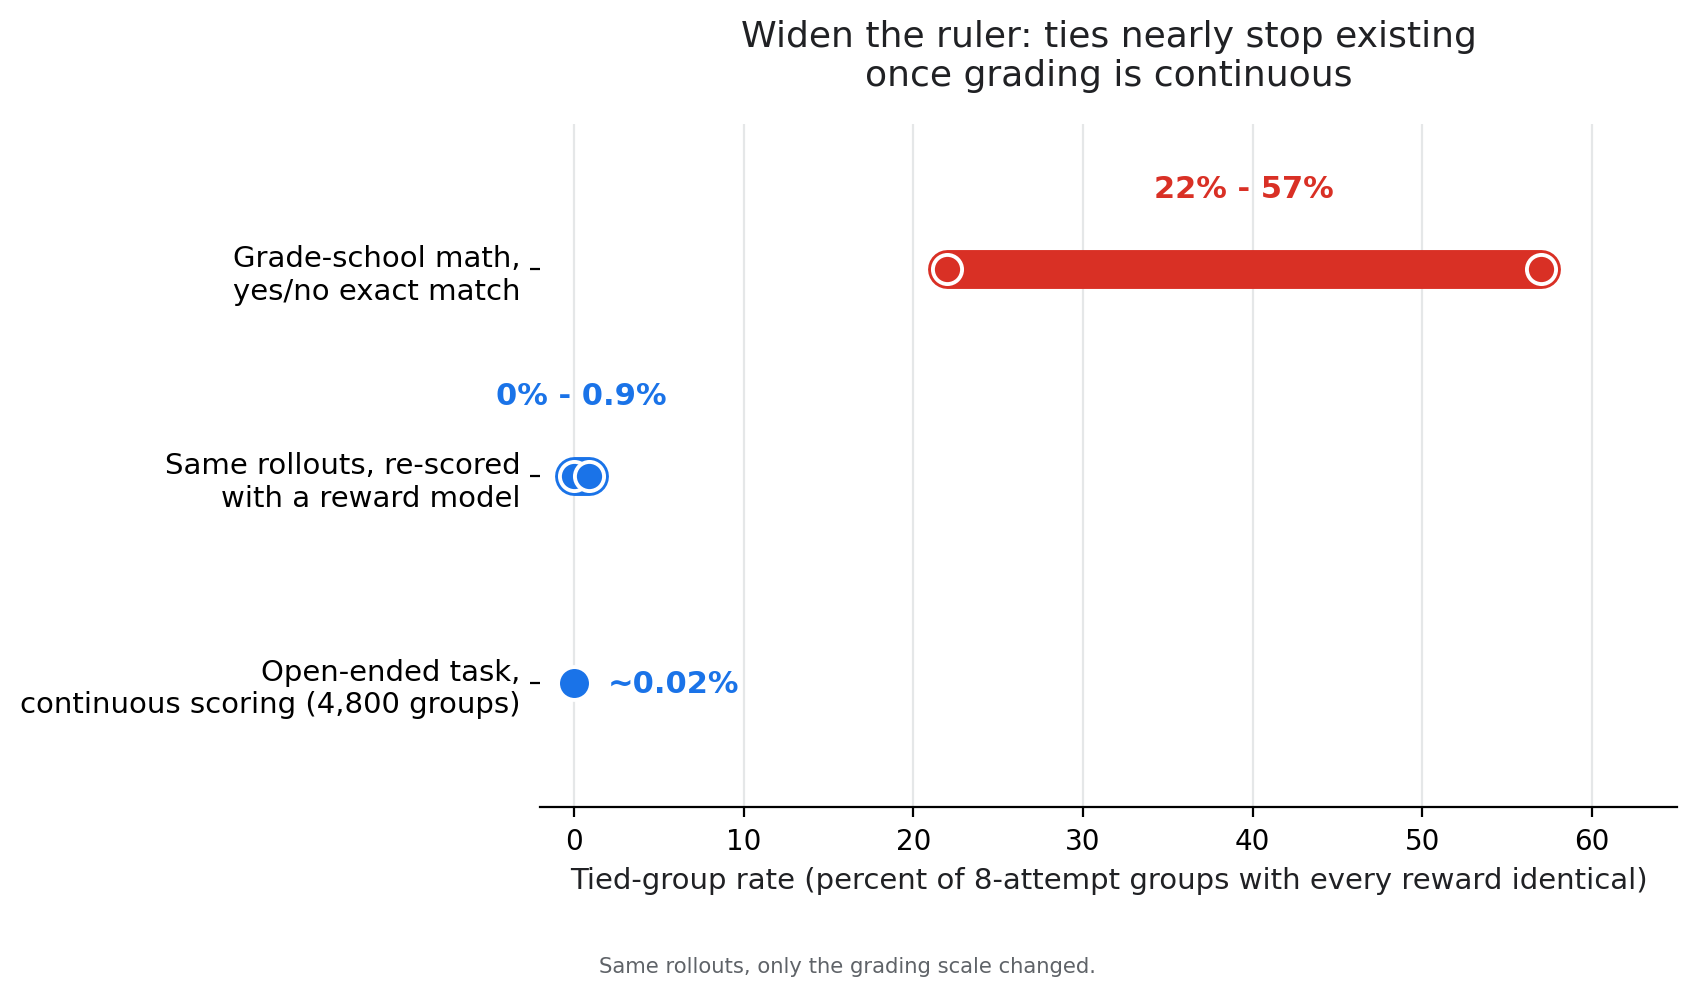
A separate run makes the same point from the other direction: a task with no single correct answer at all, graded purely by two continuous scoring models across six full training runs, 4,800 groups total. Zero of them came back exactly tied. When the grader was never binary to begin with, the dead-group problem that ate 59.7% of the trivia run’s groups essentially does not show up.
That gives an obvious use for a reward model that costs almost nothing extra, the intent being to let it speak where the checker has gone silent and stay out of the way everywhere else. The GSM8K training test from the last section tried exactly this design as a fourth way of training. Sort the attempts by the reward model’s own score within each grade class (the right ones ranked among themselves, the wrong ones among themselves), and make the final reward equal to the checker’s grade plus 0.1 times that rank, normalized so the lowest-ranked attempt in a class adds 0 and the highest adds the full 0.1.
The 0.1 is there so the reward model can never overrule a checker verdict. A wrong attempt tops out at 0 + 0.1 = 0.1. A right attempt bottoms out at 1 + 0 = 1.0. No amount of reward-model enthusiasm for a wrong answer lifts it above the worst right one, and GRPO’s centering step preserves that order, because centering subtracts and divides by the same two numbers for every attempt in the group. That property holds. It is also the only thing the 0.1 buys, and the arithmetic below is why that sentence needs saying.
The same group, all the way through the tie-break. All eight attempts above scored 0 (wrong) under the checker, so by the checker alone this group is dead. Their eight reward-model scores are the ones the training run actually recorded. Everything below is those eight stored numbers put through the training code’s own formula. Ranking the attempts by the reward model’s own score, lowest to highest (rank 0 to rank 7), and adding 0.1 x (rank / 7) to each one’s checker grade turns that flat 0 into eight different numbers:
| Attempt | Reward-model score | Rank (0 lowest, 7 highest) | Tie-break reward: 0 + 0.1 x (rank / 7) |
|---|---|---|---|
| “…47 clothes lost” | -1.78 | 2 | 0.0286 |
| “…3 items are missing” | +2.01 | 7 | 0.1000 |
| the other six attempts in this group | -4.40 to 1.67 | 0, 1, 3, 4, 5, 6 | 0.000 to 0.086 |
That group’s own mean is 0.0500 and its own spread (standard deviation) is 0.0327. GRPO’s centering step turns each tie-break reward into an advantage by subtracting that mean and dividing by that spread, plus a guard constant of 0.0001 the implementation adds so a group whose attempts all score exactly the same divides safely:
- “…47 clothes lost”: (0.0286 - 0.0500) / (0.0327 + 0.0001) = -0.65, nudged away from
- “…3 items are missing”: (0.1000 - 0.0500) / (0.0327 + 0.0001) = +1.52, nudged toward
Read that second line again. The 0.1-wide window did not make the nudge small. The full eight-attempt advantage vector for this group runs -1.52, -1.09, -0.65, -0.22, +0.22, +0.65, +1.09, +1.52.
The reason is that the same 0.1 sits on both sides of the division. Write the reward as grade + 0.1 x rank. Subtracting the group’s mean cancels the grade. Dividing by the group’s spread cancels the 0.1, because in a group where the tie-break is the only thing moving, that spread is itself 0.1 times the spread of the ranks:
advantage = 0.1 x (rank - mean rank) / (0.1 x spread of ranks)
          = (rank - mean rank) / (spread of ranks)
The 0.1 is gone. Nothing was retrained at a different coefficient to establish that. The formula answers it on its own: put the same eight stored scores through it with the coefficient set to 1.0 instead of 0.1 and the largest advantage moves from 1.52 to 1.53. Set it to 0.01 and it moves to 1.48. The coefficient sizes nothing. It controls the raw ordering margin and nothing else.
Two consequences follow, and both cut against reading this design as a light touch.
A group the checker left for dead now carries a full-strength gradient. Centering divides every group by its own spread, so every group with any spread at all comes out at the same overall scale, whatever its raw scores were. A group of eight where four attempts were right and four were wrong gets advantages of exactly plus or minus 1.00. The dead group above, opened up by the reward model alone, reaches plus or minus 1.52 at its extremes. The tie-break does not add a small increment to a silent group. It converts a zero-weight group into a full-weight one, and the attempt at the top of a formerly dead group is pushed harder than any attempt in an evenly split graded group.
The reward model’s confidence is thrown away before any of this runs. The tie-break uses the rank, not the score. Two dead groups, one where the reward model spread its eight attempts across four points of its own scale and one where it spread them across four hundredths, produce the identical advantage vector, the one printed above. A reward model that is barely telling the attempts apart and one that is certain get exactly the same full-strength say. The design has no way to express “I am not sure about this group,” which is the property to keep in mind when section 5 reports what this design costs against scoring every group.
The same arithmetic corrects one more natural reading. Because the rank is computed within each grade class, it also applies inside the groups the checker did have an opinion about. The checker’s ordering survives there untouched, exactly as designed: every right attempt still sits above every wrong one. The advantages do not pass through untouched. Take a four-right, four-wrong group from the same stored run and put its eight recorded scores through the same formula: the advantages move from a flat plus or minus 1.00 under the checker alone to a spread of 0.90 to 1.10 in size once the tie-break is layered on. Small there, and not zero.
3. The cost answer: ties are sixty cents, trust is the real bill
If a reward model can dissolve the tie problem the last section measured, the next question is what that costs. Training still learns only from the checker (GRPO’s right-or-wrong verifier, RLVR) everywhere it has an opinion. A reward model only has to score the attempts already sitting in a dead group.
The pool we scored was 131,200 attempts already sitting on disk, saved from two earlier sampling runs of this project rather than generated for the occasion. Scoring all of them with Skywork-Reward-V2-Qwen3-0.6B took about 19 GPU-minutes on one rented machine. The whole session came to about $0.60, at roughly a dollar an hour, and that figure is the session and not the scoring alone: it includes bringing the machine up, measuring the scorer’s own wobble, and tearing the machine down. Two things set the size of that bill and both are yours to change: the scorer here is a 0.6-billion-parameter model, and the larger 8-billion-parameter scorers this piece also names cost more per sequence to run.
| Step | What it costs |
|---|---|
| Generating 131,200 sequences in the first place (the policy runs token by token, for every one of them) | the actual compute bill |
| Scoring those same 131,200 already-generated sequences with the reward model (one forward pass per sequence, over text that already exists) | about 19 GPU-minutes of scoring, about $0.60 for the whole rented session |
Generation is what actually costs money. Reward-model inference, on text that is already sitting there, is a small fraction of that bill, not a comparable one.
That number is only trustworthy if the reward model doing the scoring can actually tell correct answers from incorrect ones on your own data first. AUROC, the area under the receiver operating characteristic curve, measures exactly that: take every pair of attempts where one was actually correct and the other was not, and AUROC is the fraction of those pairs the reward model ranked in the right order. A score of 1.0 means it never once ranked a wrong answer above a right one. A score of 0.5 means it does no better than a coin flip.
Here is the 0.6-billion-parameter scorer above, checked that way on the three question sets its 131,200 attempts came from:
| Question set | AUROC (reward-model score vs. ground-truth correctness) | Clears the 0.70 gate? |
|---|---|---|
| the factoid set | 0.720 | yes |
| the math set (GSM8K, short chains of reasoning) | 0.889 | yes |
| the long-chain-of-thought math set | 0.783 | yes |
| mean across all three | 0.797 | yes |
0.70 is the conventional acceptable-discrimination threshold used across classifier evaluation generally, not a bar derived specifically for reward models or for training. Treat it as a reasonable default gate to check before trusting a reward model’s ties, not as a cutoff proven to matter at this exact value.
What this does not measure is the training-time risk of a scorer the policy is actively learning to please: as training pushes a policy’s outputs away from whatever distribution the reward model was validated on, nothing guarantees the reward model’s judgments stay calibrated on that drifted distribution, and that risk has not been measured here. The open problem this section leaves behind is not whether you can afford to score with a reward model. It is whether the reward model can be trusted to keep meaning the same thing by the time the policy has finished learning to satisfy it.
4. The pre-check: five steps before you spend a training budget
A judging leaderboard cannot make this call for you, ours included, not because it is a bad leaderboard, but because grading a finished answer and teaching a policy (GRPO’s group-relative update, whether run with a plain checker under RLVR or with a reward model) are different jobs, and nothing above says the first predicts the second. Here is how to check it on your own model, mostly from rollouts you already have lying around.
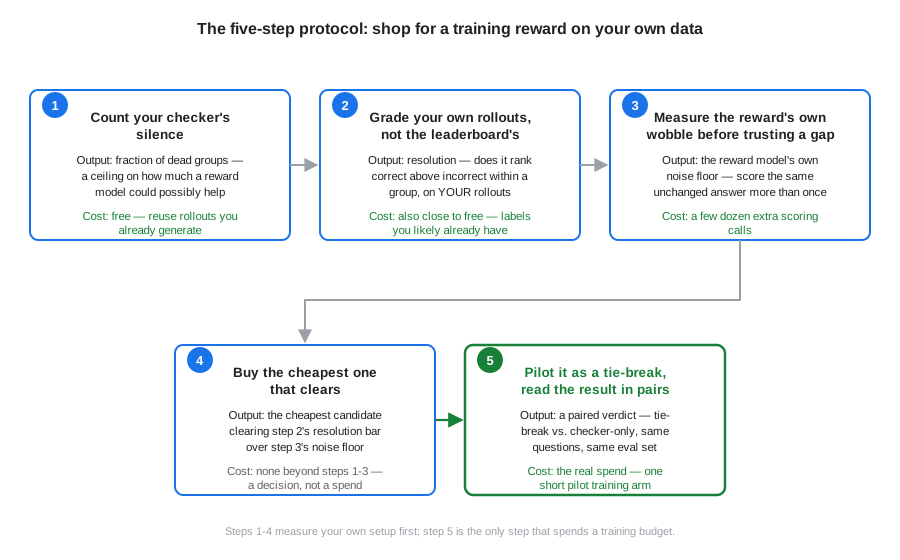
Notice: only the last step spends any of your training budget. The first four are measurements you make on rollouts and scoring calls you already have or can get cheaply.
Step 1: Count your checker’s silence. Generate the same batch of attempts you would use in training (say, eight tries per question) for a sample of your own questions, and check what fraction of those groups come back all one grade under your current checker. This fraction is a ceiling: a reward model can only help in the groups where your checker has nothing to say, and everywhere else it is redundant. Cost: free (reuses stored rollouts you already have). This number moves a lot with the task. On closed-book trivia, the checker was silent on 76% of groups at 0.5 billion parameters and 62% at 1.5 billion. On grade-school math, where the model already solves roughly half the questions, it was silent on only about 21%. Same mechanism, wildly different rate: measure yours, do not borrow either number.
Step 2: Grade your own rollouts, not the leaderboard’s. Score that same batch of attempts with each reward model you are considering, and check whether it actually puts the correct answer above the incorrect ones within each group, more often than not. Call this its resolution on your data: like AUROC, 100% means it always ranks the correct answer above the incorrect ones in a group and 50% means a coin flip, but it is computed on your own rollouts instead of a labeled benchmark, and it is a different number from either AUROC or the capture% our own ranking used, even when all three are measuring related things. Cost: free (reuses stored rollouts you already have, plus ground-truth labels you likely already have if you have a checker).
A reward model’s judging rank does not fix its resolution on your own rollouts. Skywork-Reward-V2-Qwen3-8B and GRM-Gemma2-2.6B were compared this way twice, on two different pools of our own, and the two comparisons do not say the same thing. On the first, both models scored the same attempts, drawn from a policy that solved only about 7% of the questions outright. They came out level: 88.4% for GRM against 89.4% for Skywork, a difference smaller than what redrawing the roughly 100 usable groups would move. On the second, each model scored the attempts coming out of its own grade-school-math training run, cut into eight windows from early to late, and Skywork was ahead in every one of the eight, 89.2% against GRM’s 75.6% on average.
Those are not two readings of one quantity, which is the whole point. A resolution number belongs to the pool it was measured on. The first pool’s policy solved almost nothing, so there was little for any reward model to distinguish itself on, and two models landing level there is a fact about that pool rather than a verdict on the ranking. The second measured each model on the answers its own run happened to be producing, so the two models were never scoring a common set of attempts. Neither comparison hands you a general ordering. What both hand you is the instruction: measure on the pool you are actually going to train on.
Step 3: Measure the reward’s own wobble before trusting a gap. Score a handful of unchanged answers with your candidate reward model more than once, and look at how much its score moves between scorings of the same text. That is the model’s own noise floor, the wobble you would see even if nothing about the answer changed, and without measuring it you cannot tell a real spread from the reward model talking to itself. Cost: a few dozen extra scoring calls on answers you already have, using the reward model you already loaded for step 2. No separate dollar figure is recorded for this step alone: it reuses step 2’s setup, and it is not the training run that makes up the protocol’s real spend.
A floor is quoted in that reward model’s own score units, which is why it is not a number anyone can lend you. The 0.6-billion-parameter scorer from section 3 was measured this way on the same three question sets its discrimination was checked on, and its floor came out at 0.20 on the factoid set, 0.55 on grade-school math, and 0.40 on long-chain math. Nearly 3 times apart, one model, three tasks. GRM-Gemma2-2.6B, put through the same repeat-scoring check while our ranking was being built, sits at 0.064 on its own scale. That is not GRM being three to eight times steadier than the 0.6B scorer. The two sit on different scales, and reading one model’s floor against another’s is the one thing a floor cannot be used for.
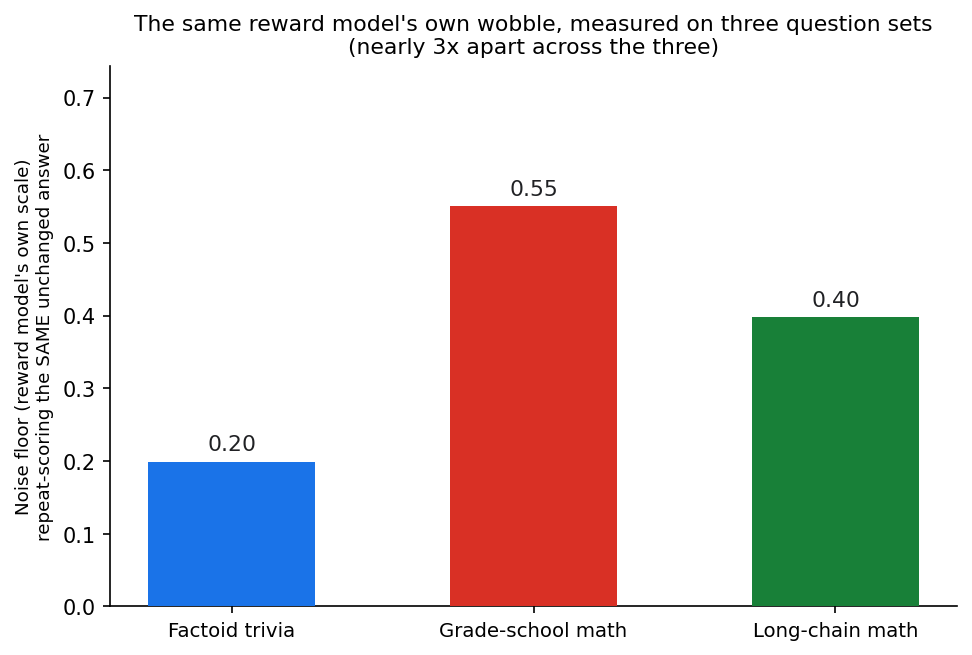
Two of our grade-school-math training runs handed a reward model’s raw score to every group, one using GRM-Gemma2-2.6B and the other Skywork-Reward-V2-Qwen3-8B. In both, the spread of scores inside a group sat 25 to 100 times above that run’s own scoring model’s floor: real signal, not noise. That figure pools every group in those runs together, and the pooling matters, because the groups the tie-break from section 2 actually touches are the tied ones, and a tied group is by construction one the checker could not separate. Nothing guarantees the reward model’s spread inside those groups looks like its spread across groups in general, and these runs never separated the two. The 25-to-100 figure is the general number, not a measurement of the case the tie-break lives in.
One number does belong to the tied case: 1.6. That is the tie-break’s 0.1-wide reward window, the entire range the eight rewards in a tied group can span, set against GRM-Gemma2-2.6B’s floor of 0.064. GRM is the reward model that run used, and the 1.6 was worked out for GRM alone. The other six models on our ranking were never checked this way.
The tempting reading of that 1.6 is that the nudge is barely above noise, and section 2’s arithmetic already rules that reading out: the 0.1 cancels out of the advantage entirely, so the width of the window is not a quantity training ever sees. What training sees is the order the reward model puts the attempts in, and an order is trustworthy exactly when the score gaps producing it clear the reward model’s own floor. Those gaps, inside the tied groups on their own, were never measured.
Step 4: Buy the cheapest one that clears. Among the candidates whose resolution on your own rollouts beats a coin flip (step 2) by a margin that also clears step 3’s noise floor with room to spare, pick the cheapest one to run, not whichever one tops a public leaderboard. Cost: nothing extra, since this step only compares numbers steps 2 and 3 already produced. In our own training test, our ranking’s better-placed reward model (Skywork-Reward-V2-Qwen3-8B, the larger and more expensive of the two to score) did not out-earn GRM-Gemma2-2.6B, the smaller, lower-ranked one. If that holds even loosely for you, paying more for the top-ranked judge buys nothing extra as a teacher once you have cleared your own gates. This specific point comparison sits inside our own margin of error, a reason to test cheap-first, not a proof that cheap always wins.
Step 5: Pilot it as a tie-break, and read the result in pairs. Run one short training run that calls your chosen reward model only in your checker’s dead groups (step 1’s number tells you how often that will be), leaving the checker’s own verdict untouched everywhere else, exactly the design taught in the last section. Cost: this is the real spend, roughly $5 on a small model, and it makes up nearly all of the whole protocol’s cost, since steps 1 through 4 are free or close to it. Compare it against checker-only using a paired read (same questions, same eval set, only the reward differs) instead of two floating percentages, because a paired read cancels the question-to-question difficulty noise that swamps small gaps between two independent-looking numbers. Our own paired read came from two separate training runs, same recipe and same random seed, one trained with the tie-break and one with the plain checker, each read at its own 100-step checkpoint on the same 500 questions. Question by question, the tie-break run got 40 right that the checker run got wrong, and lost only 15 that the checker run got right. A gap that size would show up by chance about 1 time in 1,000 if there were really nothing there. That rules out “this is just which questions got asked at eval time.” It does not yet rule out that pair of runs landing on a lucky random seed, which is what a second seed would settle before a real training budget rides on the answer.
It also matters which checker the tie-break beat. That 40-to-15 reading is one seed, on one pair of training runs, read at a single fixed checkpoint, against a plain checker. A companion piece on measurement runs the nearest thing we have to a repeat of it and lands somewhere else: 3 seeds, each side read at its own converged checkpoint, and the checker on the other side is one that also corrects its own accounting for all-same groups, dropping them from the average instead of dividing by them. Against that corrected checker the tie-break does not lead at all. It sits 0.8 to 2.2 points behind on every one of the 3 seeds, a gap too small for that piece’s rule to call either way. Different runs, read different ways. Neither is the other’s replication, and nothing in either one settles why they land on opposite sides. What the pair does say is the thing that piece is about: one seed at one checkpoint handed the tie-break a clear win, 3 seeds each at their own converged checkpoint did not, and one seed is not enough to know which answer you would get.
5. After you buy: the tie-break trades 2.7 points for half the compute and a ninth of the drift
Once you have chosen a candidate that clears steps 2 and 3, the next question is how much to use it. Section 2 taught the tie-break design: the reward model’s ranking decides inside groups the checker (GRPO’s right-or-wrong verifier, RLVR) graded identically, while the checker’s own right-or-wrong ordering governs wherever it has an opinion. Compare that against handing the reward model’s raw score to every group instead, call this second option full invocation, and here is what three different random seeds on a 2,000-question held-out pool found.
That pool needs describing exactly, because “unseen” is true of it in one sense and not in another. No question in it was seen in training, by either design. But 500 of the 2,000 were the questions the tie-break’s own stopping point had been picked on, so the tie-break had already been tuned against them, and only the remaining 1,500 were new on both counts. The split changes the answer. On the 500, the two designs read level: the tie-break lands 1.6 points behind on one seed and 0.6 ahead on each of the other two. On the fresh 1,500 it trails on every seed, by 2.5 to 4.1 points. The pooled number below covers all 2,000, with that composition inside it.
The tie-break is not a free substitute for full invocation. Over the whole 2,000, the tie-break’s final checkpoint trailed full invocation’s final checkpoint by about 2.7 percentage points on average (95% confidence interval, -4.4 to -1.0, pooled across the three seeds). In exchange for that gap, three things held on all three seeds: it was cheaper, it was steadier, and it was slower to drift. Drift was watched like this. A fixed set of answers was re-scored at each checkpoint by GRM-Gemma2-2.6B, the same reward model both designs were training against. The warning sign is its score for answers the policy keeps rewriting climbing while accuracy on those same questions stays flat. The ruler for how much climb counts is that same model’s noise floor, 0.064 on its own scale, measured the same repeat-scoring way as step 3’s floors. Because the scorer here is the very model both designs trained against, the check needs a control, and the records carry one: a third run from this study, trained on the checker alone with no reward model anywhere in its loop, was re-scored the same way and read +0.29, a rise its own confidence interval cannot distinguish from zero. The climbs in the table sit on top of that near-flat baseline.
| Metric (held-out pool, 3-seed average) | Tie-break | Full invocation |
|---|---|---|
| Training wall-clock | 11,089 seconds (about 53% of full invocation’s) | 20,830 seconds |
| Peak behavior | Converged at the same step on every seed, no give-back after its own peak | Peaked around step 175 to 200, then gave back 4.4 to 5.6 points before its own stopping rule ended it, on all three seeds |
| Rise in GRM-Gemma2-2.6B’s score for still-wrong answers, on its own scale (its noise floor: 0.064) | +0.86, about 13x its floor and about 11% of full invocation’s rise | +7.85, about 123x its floor |
Watching that last row’s number as training continues is how you would catch a reward model that has started rewarding confident-sounding answers over correct ones.
The middle row is also a warning about how the 2.7-point gap was read. Both sides above were evaluated at the checkpoint each one actually stopped at, and full invocation gave back 4.4 to 5.6 points between its own peak and that stopping point. Comparing each side at its own best checkpoint instead would therefore be a different, and probably harsher, comparison for the tie-break. That comparison does not exist: neither side was evaluated on the 2,000-question held-out pool at its peak checkpoint, only at its final one. So read 2.7 points as the gap between two finished runs, which is the decision most people face, and not as the largest gap the two designs can show.
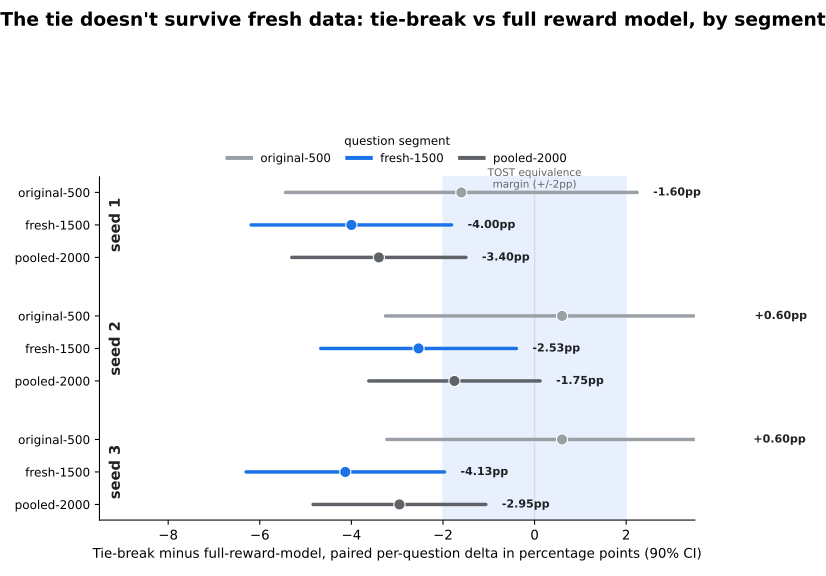
Notice: on the questions the tie-break’s own stopping rule had already been chosen against, the tie-break’s accuracy minus full invocation’s sits inside a statistical tie on all three seeds. On the fresh 1,500, every seed’s interval falls outside that tie. The tie only held on the questions the tie-break had already been tuned against, which is why the gap above is read across the whole 2,000 rather than off those 500 alone.
Section 2’s arithmetic is worth carrying into that 2.7-point gap, because the obvious explanation for it is not the only one. The tie-break is not a smaller dose of the same medicine. In the groups it touches, it hands the reward model a full-strength gradient built out of a ranking that has the reward model’s own confidence stripped from it. So a loss against full invocation is not necessarily the cost of using the reward model less. It is at least as consistent with using it at full strength in precisely the groups where its judgment is least anchored, which are the ones the checker could not separate. These runs do not separate those two explanations, and a design that scaled the tie-break’s gradient by how confidently the reward model separated the group would be the experiment that did.
Whether 2.7 points is worth about half the compute and an order of magnitude less drift is a judgment call, not a settled equivalence. It is a trade, not an upgrade. Step 1’s checker-silence number is what tells you how large that trade will be on your own setup before you run it, since it is the same fraction of groups the tie-break will actually touch.
Scope: the training results above come from one model family (Qwen2.5, at 0.5 and 1.5 billion parameters), LoRA fine-tuning, and two task families (closed-book trivia and grade-school math). The AUROC gate in section 3 and the resolution checks in section 4 add a third task family, long-chain-of- thought math, that was never itself run through training. All of it is single-seed except where stated as 3-seed above. Whether the checker-silence rate that section 2 measured stays this wide as model size grows is measured directly in a companion piece on scale, “When Your Reward Model Cannot Matter: a $2 Measurement Before Training.” There, tripling model size from 0.5 to 1.5 billion parameters roughly halved the rate at which the checker fell silent on grade-school math, 48% down to 24%. On closed-book trivia the same size step moved it far less, 76% down to 62%, which is the pair of numbers step 1 above quotes. Size opens the gate, by an amount the task decides. A companion piece on measurement covers the other half of trusting a number like any of these. Its rule for calling a winner is pooled statistical significance plus every seed agreeing in direction, and it works out what that rule costs in seeds and eval questions.